Managing Workflows in Python
Contents
Overview
Python is a widely used language in computational sciences for modelling and data analysis; however, with large amounts of data, scripts can quickly become unwiedly. mreorg is a library containing functions and tools to manage large numbers of scripts and thier output. It was written by Mike Hull as part of his Ph. D, to help manage scripts used in building models in computational neuroscience. It is designed to be as non-invasive to scripts as possible. An import mreorg statement is generally all that needs to be added to a script.
Main features:
- Works with matplotlib to:
- automatically save all plots at the end of a script (no more calls to pylab.save_figure)
- configure behaviour of show() using environmental variables, so the same script can be used to generate graphs on screen, or just save them to a file, without changing the contents of the file.
A stand-alone application mreorg.curate, for managing collections of scripts.
- web interface to launch scripts and visualise output as html
- Scripts can be queued and run sequentially
Installation
Note
(mreorg has only been tested on Linux; it should work on mac with some adjustment; if you are simulating with python on windows you may have larger problems than what mreorg can help you with :) )
To install mreorg locally (in the home directory):
Clone the git repository:
$ cd ~
$ git clone git://github.com/mikehulluk/mreorg.git
Add mreorg binaries and python files to shell-paths, by editing login scripts (normally ~/.bashrc). Add the following lines to the end of this file:
export PYTHONPATH='$PYTHONPATH:/home/YOURUSERNAME/mreorg/src/'
export PATH='$PATH:/home/YOURUSERNAME/mreorg/bin/'
Re-run your login script to take effect (or logout then log back in):
source ~/.bashrcmreorg.curate uses the django framework and dajaxice for displaying the webpages. On Ubuntu (12.4), these can be installed with:
$ sudo apt-get install python-django python-django-dajaxice.
Scripting with mreorg
mreorg controls what happens to figures generated using matplotlib. Depending on the context in which it is being used; a user may want the results of a simulation script to be displayed on the screen when it is launched from the commandline, but may want to save figures to files when the script is being called as part of a larger batch. mreorg allows this behaviour to be controlled through environmental variables and an import statement at the top of the script.
For example, the following script (mreorg/examples/examples1.py) generates a simple figure in maptlotlib.
Without any environmental variables set, mreorg will not change any behaviour and the figure will pop up on the screen as normal:
$ python example1.py
< Figure window opens >
$
By exporting different environmental variable options, we can change this behaviour:
$ export MREORG_NOSHOW=''
$ python example1.py
<- No figure window opens ->
$ unset MREORG_NOSHOW

$ export MREORG_SAVEALL=''
$ python example1.py
Saving File _output/figures/example1/eps/fig000_Autosave_figure_1.eps
Saving File _output/figures/example1/pdf/fig000_Autosave_figure_1.pdf
Saving File _output/figures/example1/png/fig000_Autosave_figure_1.png
Saving File _output/figures/example1/svg/fig000_Autosave_figure_1.svg
<- Figure window opens ->
$ unset MREORG_SAVEALL


$ export MREORG_SAVEALL=''
$ export MREORG_NOSHOW=''
$ python example1.py
Saving File _output/figures/example1/eps/fig000_Autosave_figure_1.eps
Saving File _output/figures/example1/pdf/fig000_Autosave_figure_1.pdf
Saving File _output/figures/example1/png/fig000_Autosave_figure_1.png
Saving File _output/figures/example1/svg/fig000_Autosave_figure_1.svg
<- No figure window opens ->
$
By default, figures are saved into a folder _output/figures/{scriptname}/{figtype}/{figname} within the folder containing the scripts, even if the script is called from another directory.
Environmental variables are read once when then mreorg module is initially loaded. These options can be changed within the script by setting attributes on the ScriptFlags. The monkey-patching of matplotlib can be seen in mreorg.requiredpreimport and the handling of matplotlib figures is managed by PlotManager
import mreorg
mreorg.ScriptFlags.MREORG_NOSHOW = True
mreorg.ScriptFlags.MREORG_SAVALL = False
mreorg.PlotManager.XXYYXX # set the figure types.
...
Managing Simulations with mreorg.curate
Over the course of my PhD, I found I had hundreds of simulation scripts written in python, which took different lengths of time to run, and produced lots of matplotlib graphs. I often wanted to browse through the output of these simulations, and since there was often dependancies between files; when I made changes, I wanted to know whether they had sucessfully run since the last change. I started with a system of makefiles, which slowly developed into a more user-friendly mreorg.curate, which I hope can be of use to other people.
If you are using a single simulator-program, and changing the values of commandline options you pass to it; then Andrew Davison’s Sumatra package might be a more appropriate option.
Fundementally, mreorg.curate is a database which tracks simulation files, can launch them, capture there output, and display everything through a webpage. This makes it easier to keep on top of files; and also to refactor internal libraries more confidently, since it is easy to ensure that ‘everything is up to date’.
mreorg.curate consists of a commandline tool and web-interface. It uses an SQL-lite database to store its settings.
1. Setting up ~/mreorgrc
(This is optional and covered in more detail below)
2. Creating a database
We first need to initialise an empty datadase, by running the command:
$ mreorg.curate builddb
If the database already exists, but you want to clear it out and start again, use the –rebuild flag:
$ mreorg.curate builddb --rebuild
This will wipe all existing results. By default the database is stored in ~/.mreorg/mreorg.sqlite
3. Launch the front-end
Launch the webserver with the command:
$ mreorg.curate runserver
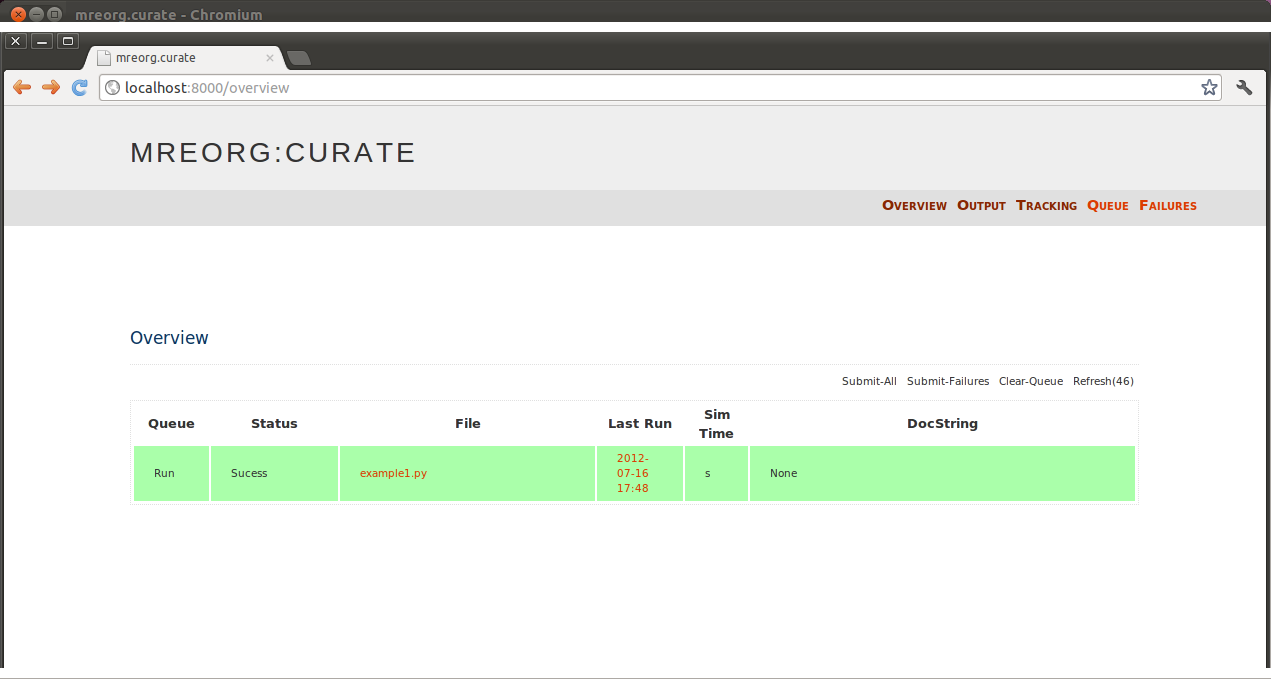
By default mreorg.curate listens on 8000. Open a web browser and navigate to localhost:8000 . (If the mreorg.curate webserver crashes and blocks the port, you can relaunch on another port with mreorg.curate -p 8001). You should be greeted with an overview window as shown.
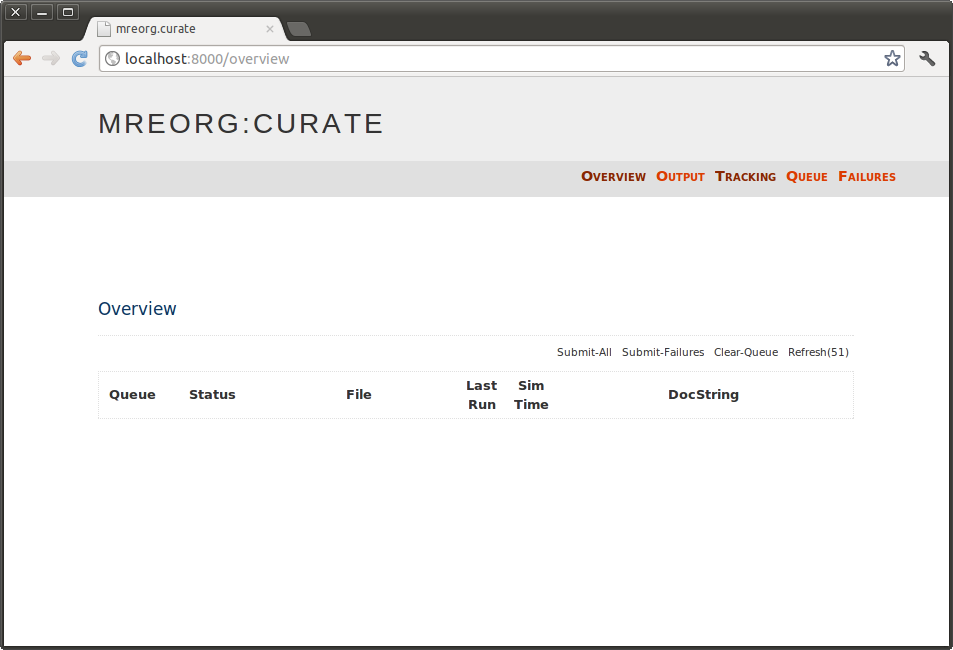
Every page has 5 navigation buttons on the right hand side (Overview, Output, Tracking, Queue, Failures). The start page is the ‘Overview’ page - this will contain a list of the simulations that are being tracked, and their current states. At the moment, no simulations are being tracked so the list is empty.
4. Track some Simulations
To use simulations, they need to be tracked by mreorg.curate. To do this, we first specify a set of ‘Monitored Directories’, which are directories that mreorg.curate is going to look for files to track.
Click the Tracking link in the top-right corner. This will bring you to a window similar to that shown:
In the section ‘Monitored Directories’, add the path of the directory where your simulation files are, and click add. This will add a new entry in the table. Check that the directory exists (Exists column), and click on the Rescan Filesystem button. (With lots of directories, rescaning the file-system can get quite slow, especially with recursive monitoring, so it is a manual command for now. If someone can improve this, that would be great)
This should populate the list of Untracked Simulations with all the .py files found in the monitored directories. In this case, we want to track example1.py so select the tickbox, and click Track Files directly underneath.
5. Queue up the Simulation
Now we have set up simulation tracking, we return to the Overview page, which should now look as follows:
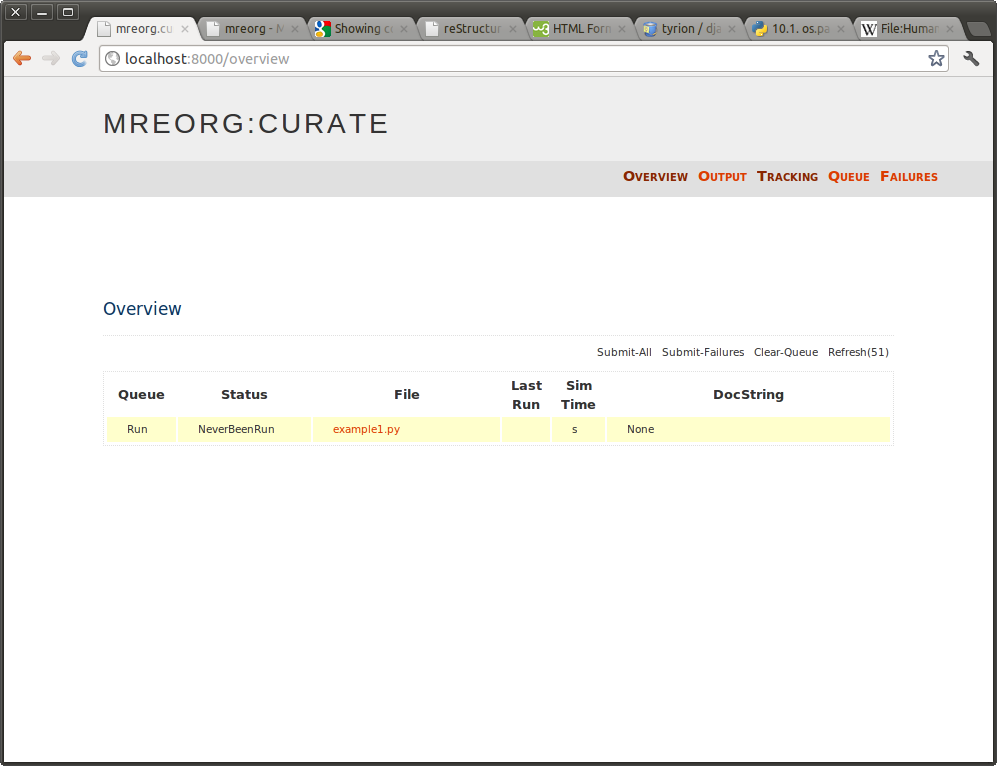
The overview page contains a single table, one row for each simulation. The colour of each row represents the current state of the simulation (also written in the status column)
- Yellow: There are no results from running this simulation; either it has never been run, or it never calls import mreorg .
- Green: On the last submission, the simulation ran fine, and the file has not changed since then. (Note dependancies are not checked)
- Orange: The simulation has changed since the last run.
- Red: The last run of the simulation failed.
In this case; we have only tracked a single simulation, and it has not yet run, so we see a single row in yellow. However, the following screen shot shows a database tracking many simulations, in which the simulations are in different states:
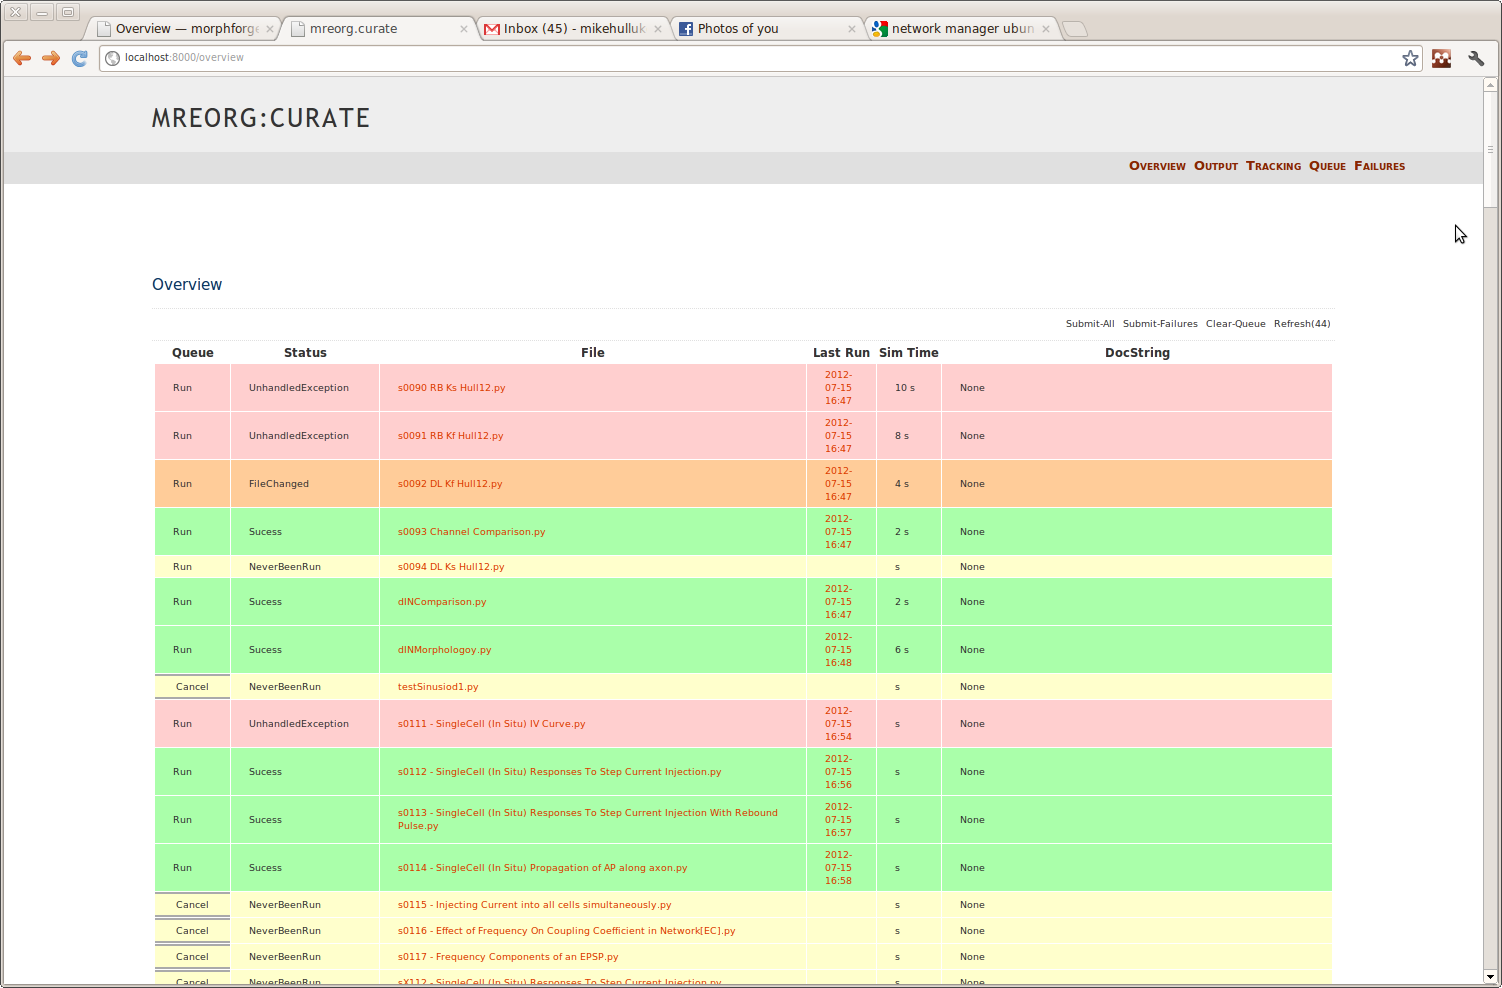
In the table, clicking on the link for a simulation in the File column will bring up more information about the file. Clicking on the link in the Last-Run (shown as a date) will provide you with more information about that particular run; for example:
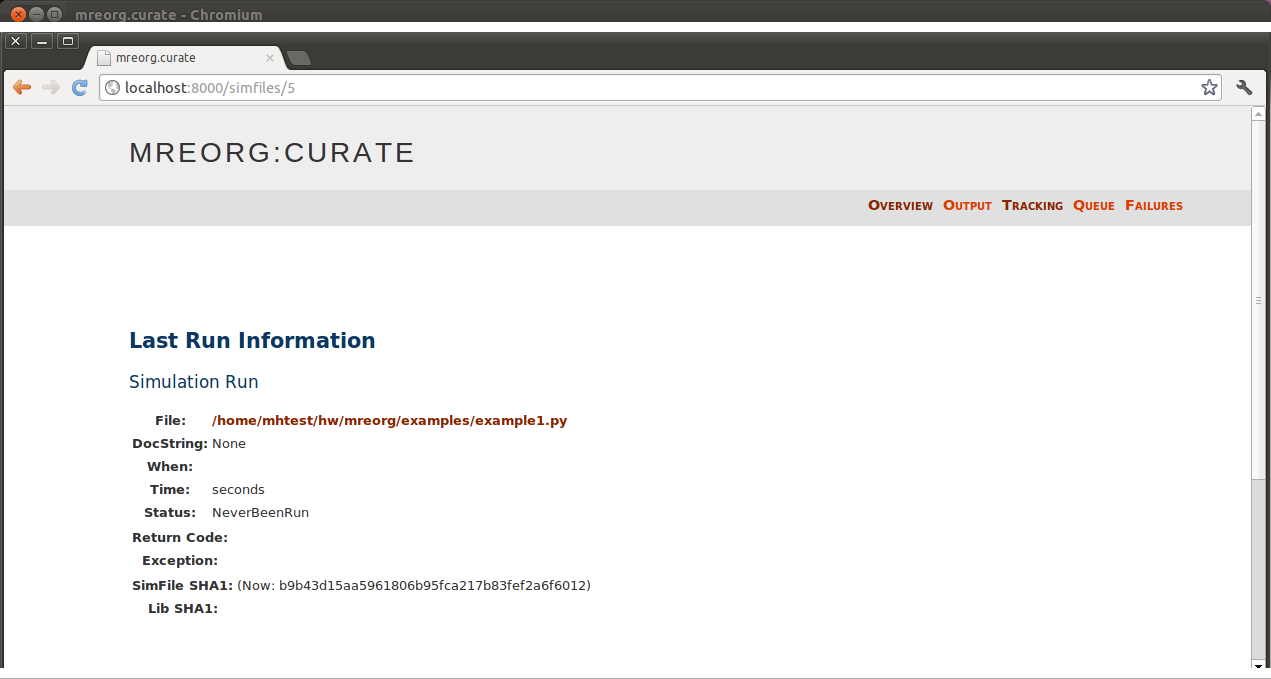
This page provides information for example about any exceptions thrown. From this pages it is possible to drop straight into an editor and terminal window by clicking on the hyperlink to the right of File. This editor can be customised in ~/.mreorgrc .
Returning to the Overview page; mreorg.curate implements a simple queue system for running simulations. Simulations can be added to the queue by clicking on Run in the first column of the row. When this happens, the text should change to Cancel and horizontal bars should appear in the box, to say the simulation is queued. Clicking this again will remove the simulations from the queue (unless they have already started). You can select multiple simulations to be queued.
6. Launch the backend
Although we have selected our simulation to run, currently nothing will happen; we need to create some backend-workers to actually run the simulations.
Returning to the command terminal, we create a process that will actually run the simulations:
$ mreorg.curate runbackend
This starts a process that will continually check for new simulations to be added to the queue. If it finds one, then it will execute it; update the database with the results; then look for another one; and so forth. It is possible to run many backends in parallel in different terminals; (they are smart enough not to run the same simulation). You can cancel a worker with Ctrl-C.
By default, a script that takes longer than 1800 secs (30 mins) will raise a TimeOutException. (I will make this configurable at some point).
When you run this command, the result should be a sucess, and after a short while, the yellow row on the overview page on the webpage should turn green automatically. (By default, the ‘Overview-Page’ updates every 60 seconds, but it is possible to force an update by reloading the entire page.)
7. Visualise the output
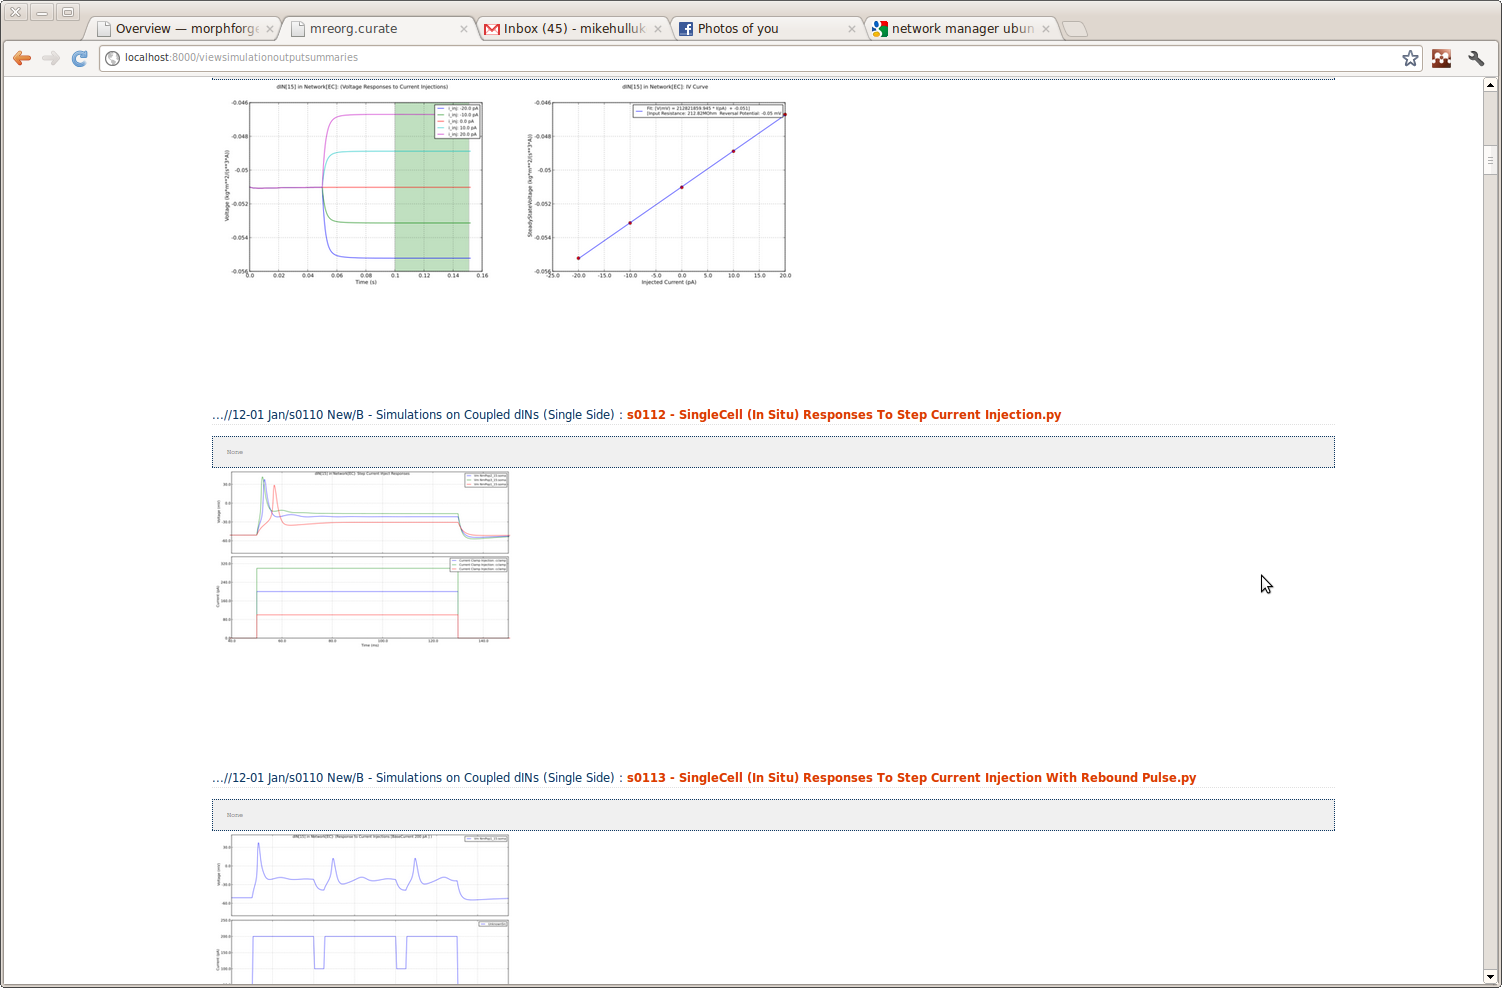
Now that the script has run; we want to see the output. One option is through the Last-Run link, but it is often more convieniant to see the output of all the simulations. This is available on the Output page. You should see something like:
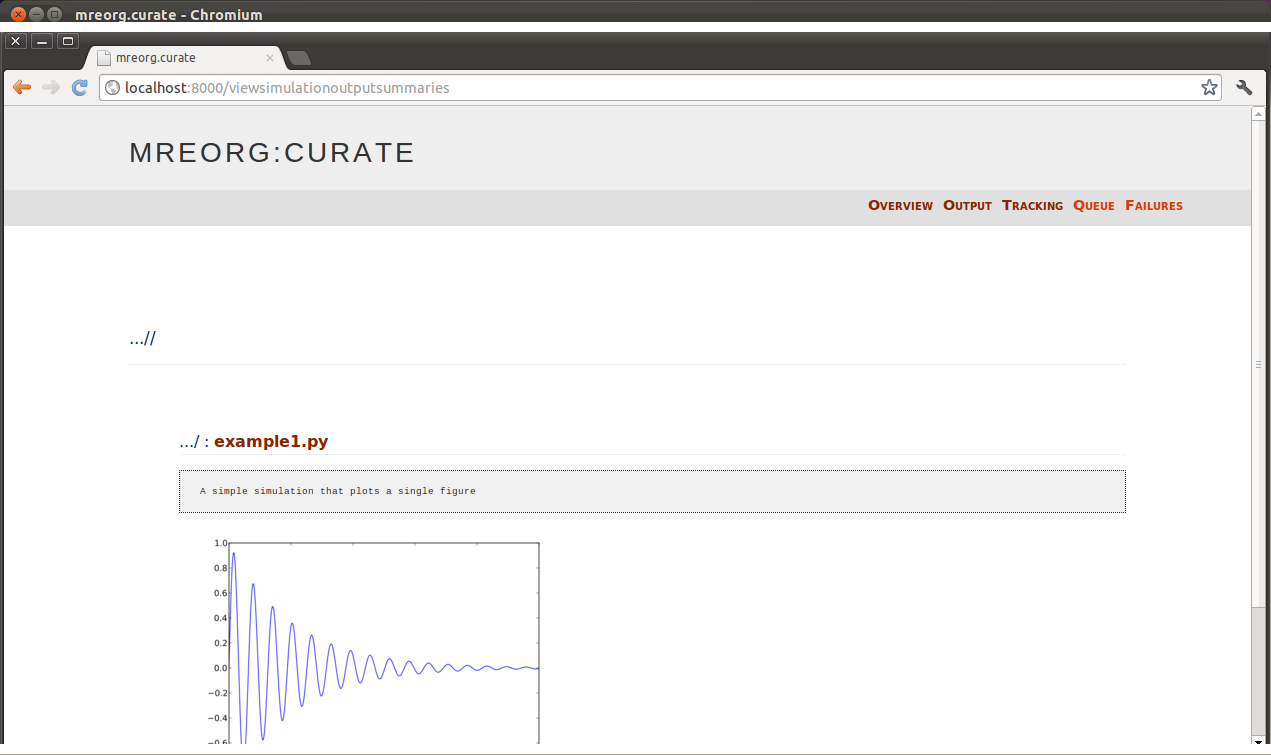
The following shows the output from multiple simulation scripts.
Configuration
Environmental Variable
mreorg recognises the following environmental variables. Thier contents is ignored, it is only important if they are set or not.
Note
In Linux, environmental variables can be set by:
$ export MREORG_XYZ=''
and unset by:
$ unset MREORG_XYZ
You can see all the environmental variables using:
$ env
# or
$ env | grep 'MREOG_XYZ'
In make files, you need to be a bit careful, either using a one-liner:
$ cat Makefile
example1.py.out: example1.py
        export 'MREORG_XYZ'; python example1.py > example1.py.out
$
Or exporting it globally:
$ cat Makefile
MREORG_XYZ=
example1.py.out: example1.py
        python example1.py > example1.py.out
$
~/.mreorgrc
mreorg can be customised using a ~/.mreorgrc file. An example is given here (from mreorg/etc_sample/.mreorgrc).
# Where shall we track by default. Adding entries here makes it easier to wipe
# the results database and restart.


# default dictionary:  {recurse='False', should_exist=False, auto_track=False}
default_monitor_directories = [
    ( "/home/michael/hw_to_come/hw-results/src/",),
    ("/home/michael/hw_to_come/morphforge/src/morphforgeexamples/", {'recurse':True, 'should_exist':True, 'auto_track':True, 'filegroup':'examples'}),
    ("/home/michael/hw_to_come/hw-results/src/12-00/", {'recurse':True, 'should_exist':True , 'auto_track':False, 'filegroup':'blah'} ),
    ("/home/michael/hw_to_come/hw-results/src/simulations_for_paper1/", {'recurse':False, 'should_exist':True, 'auto_track':True, 'filegroup':'paper2' } )
]

#default_simulations = [
#    "/home/michael/hw_to_come/morphforge/src/morphforgeexamples/singlecell_simulation/*",
#    "/home/michael/hw_to_come/morphforge/src/morphforgeexamples/**",
#    "/home/michael/hw_to_come/hw-results/src/12-00/**",
#    "/home/michael/hw_to_come/hw-results/src/simulations_for_paper1/gen*.py",
#]


default_filegroups = {
    'dIN (No-EC)': ["/home/michael/hw_to_come/hw-results/src/12-00/C Multicompartmental dIN model analysis/C. Analysis of dIN model (Individual)/*.py"],
    'dIN (EC)':    ["/home/michael/hw_to_come/hw-results/src/12-00/C Multicompartmental dIN model analysis/D. Analysis of dIN model (In Electrically Coupled Network)/*.py"],
    'paper1':      ["/home/michael/hw_to_come/hw-results/src/simulations_for_paper1/gen*.py"],
    'all-results': ["/home/michael/hw_to_come/hw-results/src/**.py"],
}


# An environmental variable of None means it should be unset if it exists.
default_runconfigs ={
    'short':{
        'timeout': 10,
        'env_vars': { 'MF_QUICK':'' }
    },
    'std':{
        'timeout': 1800,
        'env_vars': { 'MF_QUICK': None, },
        'argv': [],
    },
    'full':{
        'timeout': None,
        'env_vars': { 'MF_QUICK': None, }
    }

}


FILENAME_EXCLUDES = [
    "py.py",
    "__*.py",
    "*parsetab*",
    '/home/michael/hw_to_come/morphforge/src/bin/SimulateBundle.py',
    "*/analysis_dins.py",
    "*/dINFiles.py",
    "preload_files.py",
    "*old*.py",
    "*OLD*.py",
    "*Old*.py",
]


SIMULATION_SQLLITE_FILENAME = '/home/michael/old_home/simmgr.sqlite'
SIMULATION_IMAGE_STOREDIR = '/home/michael/old_home/.mreorg/images/'

drop_into_editor_cmds = [
    'gnome-terminal &',
    'gvim "${full_filename}"',
]


COVERAGE_CONFIG_FILE ="/home/michael/hw_to_come/morphforge/etc/.coveragerc"
COVERAGE_OUTPUT_DIR = "/tmp/morphforge_coverage_output"
Contact Information
- Email me: ?ike?ulluk@googlemail.com where ?s can be found at the top of the page!
- GitHub: https://github.com/mikehulluk/mreorg